

For businesses operating in October 2026, the landscape of global shipping has fundamentally transformed. The era of predictable, stable freight rates feels like a distant memory. We’ve entered a new phase where shipping costs increase 2025 marked a significant turning point, with this trend continuing robustly into 2026.
The numbers speak volumes. U.S. logistics costs soared to an estimated $2.6 trillion in 2024, accounting for nearly 9% of the nation’s GDP. This isn’t merely about incremental adjustments; it’s a structural shift driven by a confluence of powerful forces. While carrier General Rate Increases (GRIs) capture headlines, the real impact on businesses often far exceeds these published figures, sometimes reaching 10-18% due to stacking surcharges, leading to significant landed cost inflation.
From escalating geopolitical tensions in critical maritime choke points like the Red Sea and the Strait of Hormuz—which force vessels onto longer, costlier routes—to the ripple effects of new US tariffs and port fees, every link in the supply chain is under immense pressure. Understanding these compounding macro cost pressures on freight from 2024 to 2026 is crucial for survival.
This extensive guide aims to demystify these complex dynamics. We will delve into the primary factors fueling this surge and, more importantly, equip you with practical strategies to mitigate rising freight costs, protect your margins, and foster resilience in your operations. For a detailed shipping cost analysis and insights into navigating these challenges, understanding the underlying drivers is key.
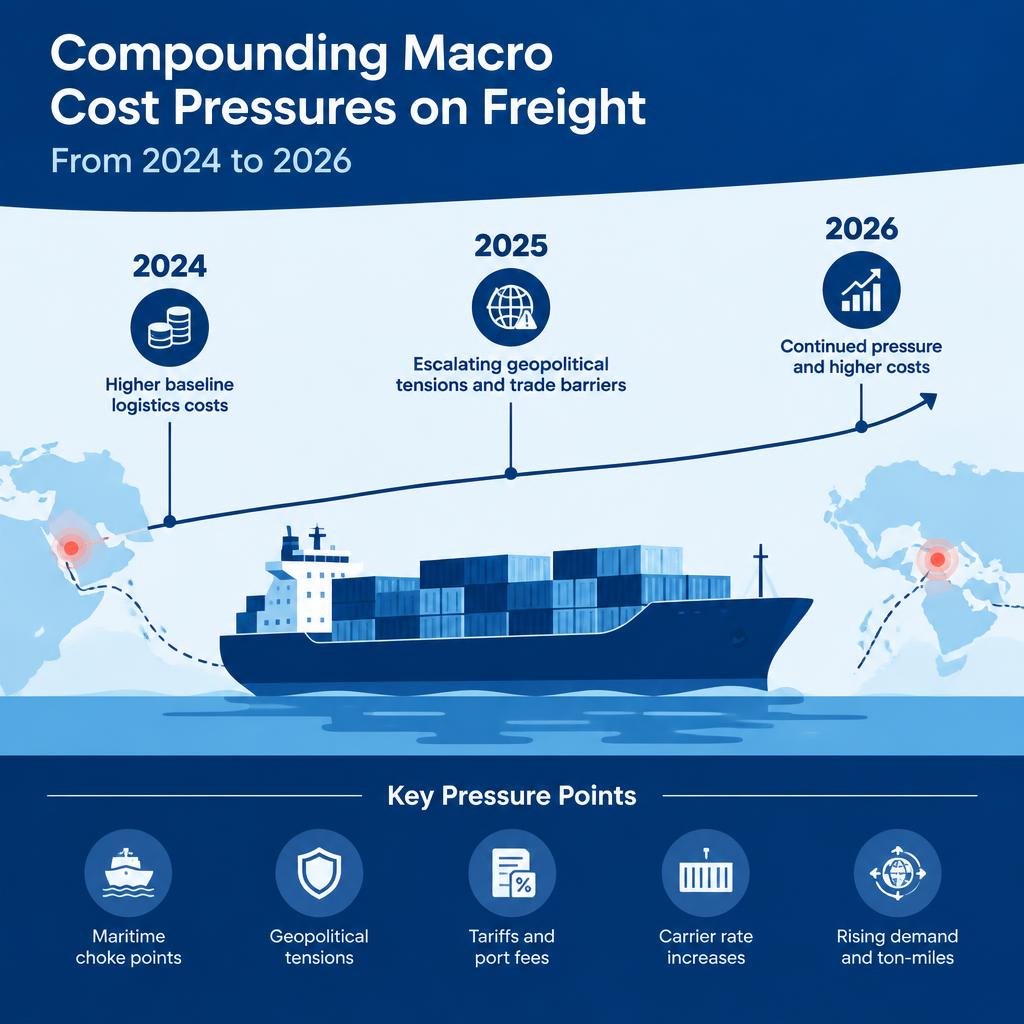
The pervasive volatility in ocean freight rates, coupled with an unprecedented expansion in ton-miles, has created significant friction across global supply chains. While new shipping capacity is entering the market, carrier capacity management strategies and persistent geopolitical disruptions mean that this additional supply is not translating into lower rates. Instead, we are witnessing a structural shift that demands innovative approaches to logistics.
Red Sea and Strait of Hormuz Disruptions
The Red Sea crisis, ignited by Houthi attacks, became a defining factor in 2025, forcing approximately 90% of container ships to reroute around the Cape of Good Hope. This diversion added 10-14 days and thousands of nautical miles to voyages, drastically extending transit times. For instance, ocean freight rates on the critical Asia-Europe route surged by a staggering 567% to $10,000 per 40ft container at their peak in 2025, a dramatic increase from $1,500 pre-crisis levels. Even by Q3 2025, rates remained 140% above normal. This rerouting not only increased fuel consumption by up to 30% for China-Europe shipments but also drove up bunker fuel prices and insurance premiums, which carriers passed directly to shippers.
Compounding this, the potential for disruption or closure of the Strait of Hormuz, a vital artery for global energy supplies, further exacerbated energy and fuel surcharges throughout 2025 and into 2026. The combined impact of these geopolitical bottlenecks meant that water transport costs in the U.S. alone rose by 93.1% year-over-year in 2024, largely driven by these extensive rerouting efforts. These disruptions are not temporary; their persistence contributes to the “new normal” of elevated freight costs.
Tariffs, Port Fees, and Regulatory Shifts
Beyond geopolitical flashpoints, governmental policies and regulatory changes have added significant layers of cost. New U.S. tariffs and port fees, particularly those effective October 14, 2025, have begun to impact inbound and outbound shipping. The USTR imposed fees ranging from $18 to $50 per net ton each time Chinese-built vessels, or those operated by Chinese companies, enter a U.S. port. This directly hits carriers, with one major U.S. freight ship owner, Atlantic Container Line (ACL), facing an estimated $34 million annual tariff bill. These costs are inevitably passed down the supply chain, affecting consumer prices.
Furthermore, the termination of the U.S. de-minimis exemption for China on May 2, 2025, and for all countries on August 29, 2025, means that more low-value shipments are now subject to duties, increasing the overall landed cost of goods. On the regulatory front, the EU carbon taxes are set to rise by 75% in January 2025, adding further pressure on pricing for European trade lanes as carriers factor in higher environmental compliance costs. These tariffs and fees trigger companies to accelerate inventory movements to preempt higher costs, which in turn drives up demand for container space and elevates rates.
The Real Math of Carrier General Rate Increases (GRIs)
While headline figures often cite an average 5.9% General Rate Increase (GRI) from major carriers like FedEx and UPS in 2026 (marking the third consecutive year at this level), the reality for e-commerce brands and Direct-to-Consumer (DTC) businesses is far more severe. This headline rate distorts the true cost increase due to the pervasive practice of surcharge stacking.
Surcharges, which now represent approximately 33% of an average package cost, significantly compound the effective rate. These include:
- Fuel Surcharges: Directly tied to volatile energy prices, these can fluctuate weekly and add substantial cost.
- Residential Delivery Fees: Often overlooked, these surcharges can add significant per-package costs, with FedEx’s residential surcharge rising 8.4% and UPS’s by 6.6% in 2026.
- Delivery Area Surcharges (DAS) / Remote Area Surcharges: These fees apply to deliveries in less accessible areas. For instance, the UPS SurePost Delivery Area Surcharge increased by a staggering 61.8% from $3.80 to $6.15 in 2025, with Extended DAS rising 69.4%.
- Dimensional Weight Surcharges: Penalties for packages that take up more space than their actual weight suggests.
- Additional Handling and Oversize Surcharges: Applied to packages exceeding certain size or weight thresholds.
- Address Correction Fees: Both FedEx and UPS charge over $20 for incorrect addresses.
When all these surcharges are factored in, the effective cost increase for DTC brands typically falls between 10-18%, far exceeding the publicized GRI. This makes a thorough shipping cost analysis indispensable for businesses to understand their true expenditure and identify areas for mitigation.
Core Pillars of Supply Chain and Logistics Optimization
In this environment of relentless cost pressures, businesses cannot afford to rely on tactical, short-term fixes. Instead, a strategic shift towards structural cost reduction and enhanced operational resilience is paramount. This involves a comprehensive approach to network modeling and total landed cost control, moving from reactive adjustments to proactive, data-driven optimization.
Here’s a comparison illustrating the shift required:
Feature Traditional Logistics Management Optimized Dynamic Models Carrier Strategy Single or few carriers, annual negotiation Multi-carrier, diversified, continuous rate comparison Inventory Strategy Centralized, just-in-time focus Decentralized, multi-node, safety stock buffers Technology Use Basic tracking, manual processes AI-driven analytics, real-time visibility, automation Cost Focus Freight rate per shipment Total landed cost, per-order economics, margin protection Resilience Reactive to disruptions Proactive risk mitigation, flexible rerouting capabilities Packaging Approach Standardized, off-the-shelf Optimized for dimensional weight, custom sizing Fulfillment Model Single warehouse or few, regional Distributed, zone-skipping, integrated 3PL networks Packaging Redesign for Supply Chain and Logistics Optimization
One often-overlooked area for significant cost savings lies in packaging. Dimensional weight (DIM) pricing means carriers charge based on package volume rather than actual weight if the DIM weight is greater. This can lead to unexpected and substantial penalties.
Businesses should conduct thorough packaging audits to:
- Optimize Custom Carton Sizing: Eliminate unnecessary void space by using custom-sized boxes that fit products snugly.
- Reduce Void-Fill: Minimize the use of packing peanuts, air pillows, or paper by improving product fit, decreasing overall package dimensions.
- Minimize Parcel Tier: Redesign packaging to fall into lower dimensional weight tiers, which can dramatically reduce shipping costs per package.
- Implement Packaging Audit Protocols: Regularly review and adjust packaging strategies as product lines or carrier rules change to ensure ongoing efficiency. A DTC apparel brand, for example, reduced its per-package cost by 12% after a comprehensive packaging audit focusing on dimensional weight.
Multi-Node Fulfillment and Inventory Pre-Positioning
The strategy of multi-node fulfillment and inventory pre-positioning has become a critical defense against rising freight costs and supply chain disruptions. By strategically distributing inventory across multiple regional warehouses, businesses can significantly reduce the shipping zones for their last-mile deliveries, directly impacting costs.
Key benefits and strategies include:
- Regional Warehousing: Placing inventory closer to end-customers reduces transit distances, leading to lower last-mile delivery costs and faster delivery times.
- Zone Skipping: This technique involves consolidating shipments to a regional hub closer to the final delivery zones, then injecting them into the carrier network at a lower-cost point. Integrated 3PLs often excel at this, leveraging their extensive networks.
- Inventory Placement Algorithms: Utilizing data analytics and predictive modeling to determine optimal inventory locations, balancing carrying costs with shipping cost reductions and service level improvements.
- Transit Zone Compression: By reducing the number of zones a package travels through, businesses can mitigate the impact of zone-based surcharges.
- Last-Mile Cost Mitigation: Shorter distances mean less fuel, fewer surcharges, and reduced exposure to last-mile delivery fees, which are a significant component of overall shipping costs.
This approach also provides crucial insulation against transit delays caused by geopolitical events like the Red Sea crisis or potential port strikes. Companies that increased safety stock and diversified storage locations saw inventory carrying costs rise by 13.2% in 2024, but this investment paid off by protecting against stockouts and ensuring continuity.
Operational Tactics to Offset Compounding Surcharges
Beyond structural changes, daily operational tactics are vital for mitigating the relentless pressure from compounding surcharges and maintaining profitability. Proactive planning, especially for peak season, combined with smart technology and carrier management, can make a substantial difference. Businesses must also be vigilant about parcel audit automation, accessorial charge mitigation, and understanding contract tier thresholds to avoid unexpected costs.
Carrier Diversification and Mode Optimization
Relying on a single carrier or mode of transport is a significant vulnerability in today’s volatile market. A diversified approach offers flexibility, cost control, and resilience.
- Multi-Carrier Routing: Instead of exclusive contracts, businesses should leverage multiple carriers, including regional parcel carriers, to optimize routes and rates for different package types, destinations, and service levels. Implementing shipment-level rate comparison tools allows for real-time decision-making, ensuring the most cost-effective option is chosen for each delivery.
- Ocean-to-Rail Intermodal Shifts: For longer distances within continents, shifting from costly truckload services to intermodal rail can provide significant savings. This is particularly relevant for inbound freight from ports, where containers can be transferred directly to rail for inland distribution.
- Volume Balancing: Distribute shipping volume across various carriers to maintain leverage and negotiate better rates. This also prevents over-reliance on one provider, which could lead to disruptions during peak periods or service issues.
- Contract Negotiation: When rates are volatile, negotiating multi-year contracts can provide stability. However, these contracts must include flexible clauses to adapt to changing market conditions. Regularly reviewing and renegotiating contracts based on actual shipping patterns and market benchmarks is crucial. Diversifying ports and adjusting shipping schedules can also mitigate ocean freight volatility.
Digital Visibility in Supply Chain and Logistics Optimization
In an increasingly complex logistics environment, digital visibility is no longer a luxury but a necessity. It empowers businesses to make data-driven decisions, anticipate disruptions, and optimize costs.
- Freight Index Benchmarking: Regularly monitoring global and regional freight indices (e.g., Platts Container Index, Drewry, Xeneta) provides real-time insights into market rates, helping businesses benchmark their own costs and negotiate effectively. The Platts Container Index, for example, rose 80% during the 30 days ended June 24, 2026, highlighting the need for constant vigilance.
- Predictive ETA Tracking: Advanced tracking systems offer predictive Estimated Times of Arrival (ETAs), allowing businesses to proactively manage inventory, inform customers, and avoid costly delays or demurrage charges.
- Automated Customs Documentation: Digital platforms can automate the generation and submission of customs documents, reducing errors, accelerating clearance processes, and preventing fines or delays.
- Demurrage Prevention: Real-time visibility into container movements and port congestion helps businesses avoid demurrage (charges for containers remaining at the port beyond the allotted free time) and detention (charges for keeping carrier equipment outside the port beyond free time) fees.
- API Rate Shopping: Integrating with carrier APIs allows businesses to instantly compare rates across multiple providers for specific shipments, ensuring they always select the most economical and efficient option.
- Investment in AI-Driven Logistics Tech: AI and machine learning tools can analyze vast amounts of data to forecast freight cost trends, optimize routes, identify potential disruptions, and even automate rate negotiations, leading to significant cost savings and improved efficiency.
Long-Term Outlook: Adapting to the Structural Baseline
The current environment is not a temporary blip; it represents a structural shift in global logistics. U.S. logistics costs, having reached $2.6 trillion in 2024, are now settling into a new baseline, representing approximately 8.8% of the nation’s GDP in 2025. This indicates that the elevated costs are a permanent feature, not a cyclical anomaly. Despite new fleet deliveries expected in 2026, the lag in capacity adjustment, combined with ongoing geopolitical instability and regulatory changes, means rates are unlikely to return to pre-2024 levels.
This new reality necessitates a long-term strategic pivot, including greater adoption of nearshoring and regionalization of supply chains. Companies are increasingly shifting manufacturing and sourcing closer to their end markets, for example, to Mexico or Central America, to reduce long-haul freight expenses, shorten lead times, and enhance resilience against international disruptions. This strategic move helps cushion against the volatility seen in major global trade lanes:
Trade Lane Key Disruptions (2025-2026) Rate Impact (Example) Mitigation Strategies Asia-Europe Red Sea rerouting, Suez Canal disruptions, EU carbon taxes 567% surge to $10,000/FEU (peak 2025) Cape of Good Hope routing, multimodal, inventory pre-positioning Asia-US East Coast Red Sea rerouting, potential US port strikes 62% MoM increase to $7,880/FEU (June 2026) US West Coast diversion, intermodal rail, nearshoring Asia-US West Coast Red Sea cargo diversions, port congestion (Oakland) 214% YoY increase (2024), 63% jump to $2,700/FEU (2025) Alternative ports (Canada, Mexico), long-term contracts Intra-Regional (e.g., US) Carrier GRIs, surcharges, labor shortages, fuel volatility 93.1% YoY water transport (2024), 10-18% effective parcel increase Zone skipping, multi-node fulfillment, packaging optimization The ongoing Middle East tensions suggest that Cape of Good Hope routing may persist well into 2026, further solidifying the higher cost base. Businesses must embed this structural cost baseline into their financial planning, pricing models, and overall competitive strategy. Those who treat logistics as a competitive advantage, rather than a mere cost center, will be best positioned to thrive in this new environment.
Frequently Asked Questions About Shipping Costs and Logistics
The current logistics landscape raises many critical questions for businesses striving to manage costs and maintain operational efficiency. Here, we address some of the most pressing concerns.
Will freight rates return to pre-2024 baselines?
The consensus among industry experts is that freight rates are unlikely to return to pre-2024 levels. We are facing a “new normal” characterized by structural rate floors. Several factors contribute to this:
- Sustained Transit Diversions: Geopolitical tensions, particularly in the Red Sea, are expected to persist, keeping vessels on longer, costlier routes around the Cape of Good Hope for the foreseeable future.
- Permanent Carrier GRIs: General Rate Increases from major carriers are cumulative and become permanent additions to the rate base each year.
- Operational Overhead Baselines: Increased fuel costs, higher insurance premiums, stricter environmental regulations (like EU carbon taxes), and increased labor costs have permanently elevated the operational overhead for carriers. Even with new capacity entering the market, these underlying costs mean rates will remain significantly higher than historical averages, likely 50%+ above pre-2024 levels.
Why do parcel invoices exceed the standard 5.9% GRI?
While carriers announce an average 5.9% General Rate Increase (GRI), the actual increase seen on parcel invoices for many businesses is often between 10-18%. This discrepancy is primarily due to the compounding effect of various surcharges:
- Surcharge Compounding: GRIs apply to base rates, but surcharges are often calculated as a percentage of the base rate or are fixed fees that also increase annually. When a 5.9% increase is applied to a base rate, and then additional surcharges (fuel, residential, delivery area) are layered on, the total cost escalates disproportionately.
- Fuel Surcharge Multipliers: Fuel surcharges are dynamic and tied to fuel prices. As fuel costs rise, the percentage-based surcharge increases, amplifying the total cost.
- Extended Delivery Area Surcharges (DAS): These fees have seen some of the most dramatic increases, such as the UPS SurePost DAS rising over 60% in 2025. These significant jumps for specific delivery locations push the overall invoice much higher than the base GRI. The combination of these factors means that the “effective rate increase” on a typical parcel often far outstrips the headline GRI.
How does inventory pre-positioning protect operational margins?
Inventory pre-positioning, or multi-node fulfillment, is a powerful strategy to protect operational margins in a high-cost shipping environment. It works by:
- Shipping Zone Reduction: By placing inventory closer to customers in regional warehouses, businesses can ship packages across fewer carrier zones. This directly reduces zone-based shipping costs, which are a major component of parcel rates.
- Lower Last-Mile Delivery Costs: Shorter distances from fulfillment centers to end-customers translate into lower fuel consumption, fewer accessorial charges, and often access to more economical last-mile delivery options.
- Transit Delay Insulation: Distributed inventory acts as a buffer against unexpected supply chain disruptions, such as port congestion, geopolitical rerouting, or carrier delays. Having stock closer to the customer reduces reliance on long-haul transportation, making the supply chain more resilient.
- Stockout Prevention: By decentralizing inventory, businesses can better manage regional demand spikes and avoid costly stockouts, which can lead to lost sales and customer dissatisfaction. This strategy not only reduces direct shipping expenses but also enhances customer satisfaction through faster delivery times, ultimately contributing to stronger operational margins.
Conclusion
The current era of elevated shipping costs, marked by the significant shipping costs increase 2025 and its continuation into 2026, demands a fundamental rethinking of supply chain and logistics strategies. From persistent geopolitical disruptions and rising regulatory burdens to the insidious impact of compounding surcharges, businesses face a complex and challenging environment.
However, this challenge also presents an opportunity for those willing to embrace agility, proactive network optimization, and stringent carrier contract control. By focusing on structural changes like packaging redesign and multi-node fulfillment, coupled with operational tactics such as carrier diversification and leveraging digital visibility, businesses can not only mitigate rising costs but also build more resilient, efficient, and competitive supply chains. Protecting margins in this new normal requires a holistic and data-driven approach, transforming logistics from a cost center into a strategic advantage.